Histograms
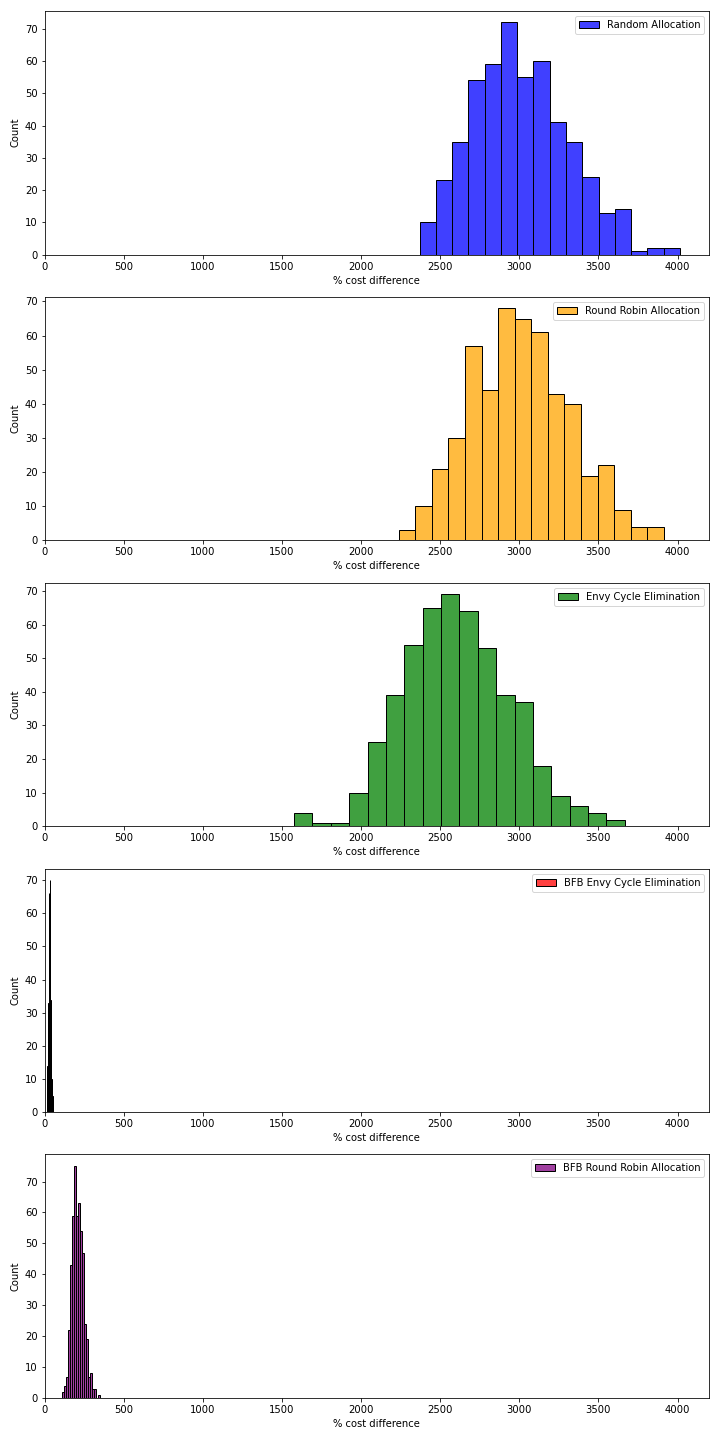
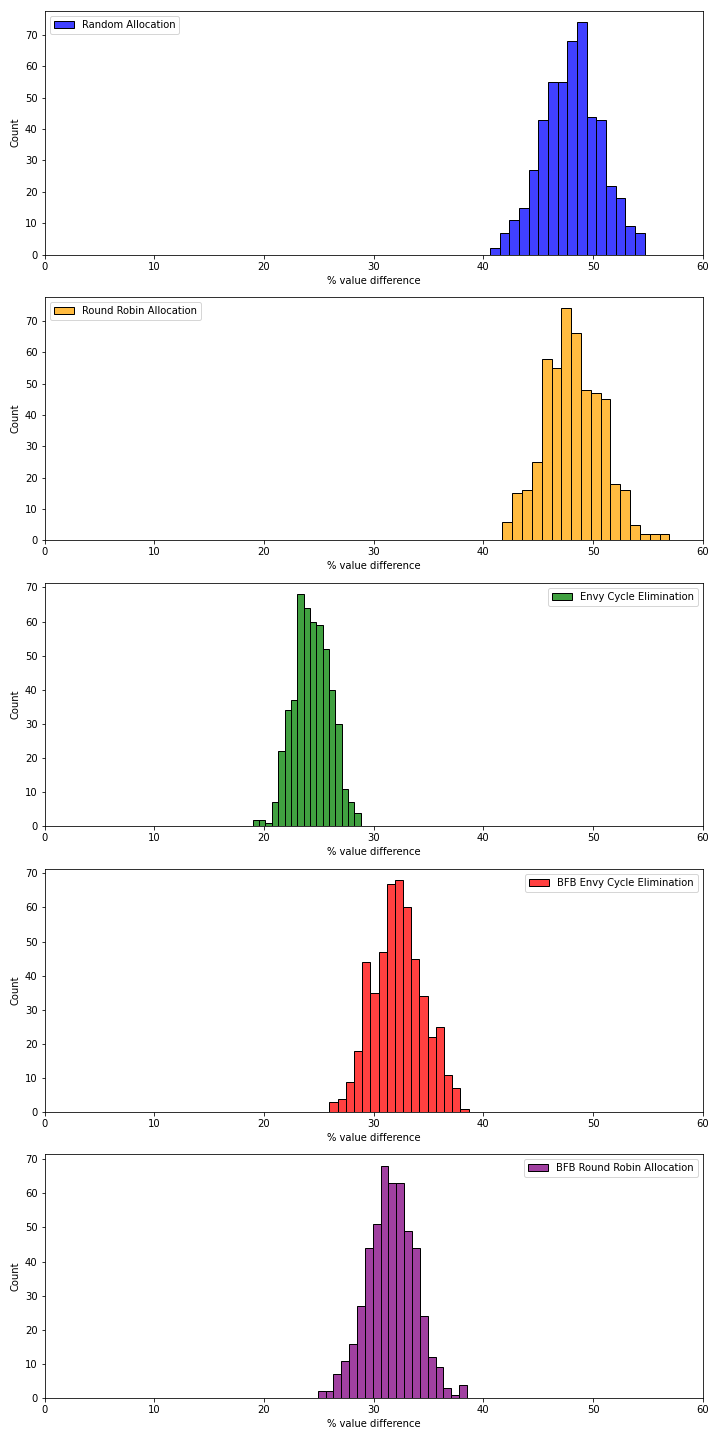
These histograms represent the costs and values of different approaches.
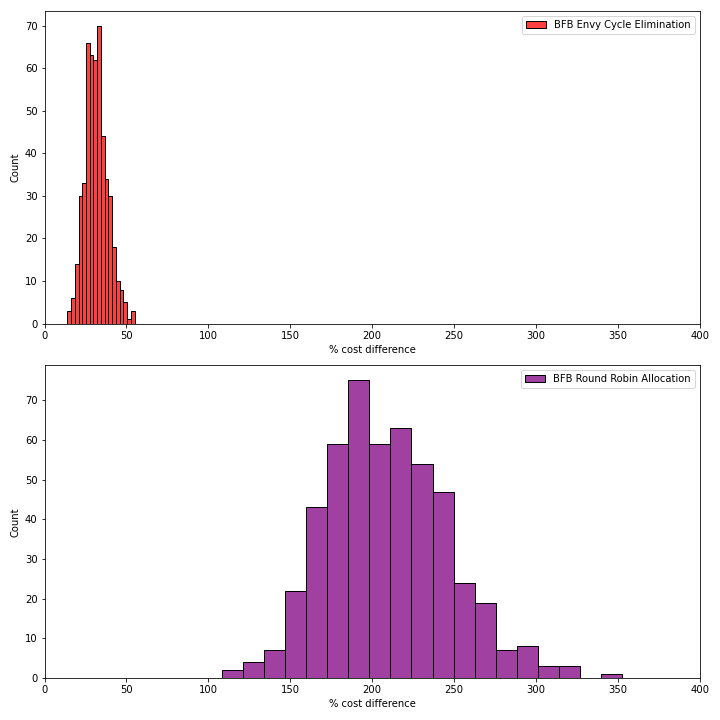
We also compare the costs of the two best-performing approaches: Bang For Buck Envy Cycle elimination approach with the Bang for Buck Round Robin approach.
These histograms represent the costs and values of different approaches.
We also compare the costs of the two best-performing approaches: Bang For Buck Envy Cycle elimination approach with the Bang for Buck Round Robin approach.